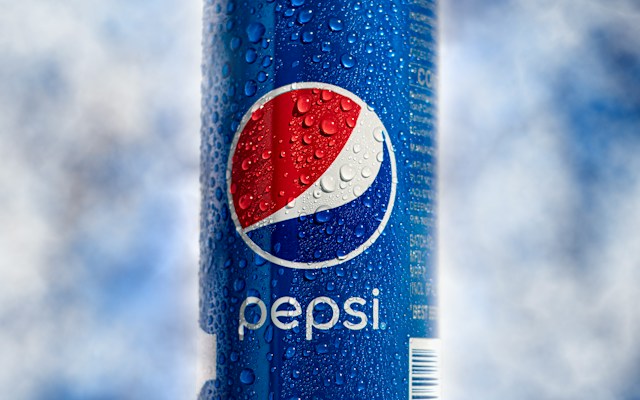
PepsiCo is one of the world’s largest beverage and convenient-food companies, combining a broad portfolio of food and drink brands with a global manufacturing, distribution and franchise system. Its portfolio includes Lay’s, Doritos, Cheetos, Gatorade, Pepsi-Cola, Mountain Dew, Quaker and SodaStream. Through its own operations, authorized bottlers, contract manufacturers and other third parties, PepsiCo serves consumers in more than 200 countries and territories.
The scale of this model is visible in PepsiCo’s 2025 results. Net revenue reached $93.925 billion, up 2% from $91.854 billion in 2024. However, operating profit declined 11% to $11.498 billion and operating margin fell from 14.0% to 12.2%. These numbers show both sides of PepsiCo’s model: extraordinary revenue diversification and brand scale, but also significant exposure to commodities, tariffs, consumer demand, restructuring, acquisitions and brand impairment.
PepsiCo’s business model is more diversified than a pure beverage company. In 2025, beverages represented 42% of consolidated net revenue while convenient foods represented 58%. The company also combines company-owned production and distribution with franchise beverage economics. This gives PepsiCo several distinct revenue engines across products, geographies and operating structures.
PepsiCo Business Strategy 2026
Industry Background and the Problem PepsiCo Solves
The global beverage and convenient-food industry must satisfy a basic but demanding consumer need: people want products that are enjoyable, convenient, available where and when they want them, appropriately priced and increasingly aligned with changing expectations around nutrition, functionality and sustainability. For a company operating at PepsiCo’s scale, satisfying this demand requires much more than manufacturing a snack or beverage. It requires brands, product innovation, procurement, manufacturing, packaging, logistics, retailer relationships, shelf execution, advertising and consumer insight.
PepsiCo identifies brand recognition and loyalty, taste, price, value, quality, variety, innovation, distribution, shelf space, marketing, packaging, convenience and service as important competitive factors. Consumer preferences are also evolving. The company highlights health and wellness, affordability, e-commerce, online-to-offline channels, artificial-intelligence shopping agents, functional products, protein and fiber, packaging concerns and changing perceptions of processed foods among the factors influencing demand.
This creates a portfolio problem. A consumer may want indulgent snacks in one occasion, hydration in another, a carbonated beverage with a meal, convenient breakfast products in the morning or products with different nutritional characteristics as preferences change. PepsiCo attempts to solve this by participating across multiple consumption occasions rather than relying on one product category.
Scale creates another industry challenge: physical availability. Food and beverage brands only create value when products are available in stores, restaurants and other channels at the right time. PepsiCo therefore combines direct-store-delivery systems, warehouse distribution, authorized bottlers, independent distributors, foodservice distribution and third-party manufacturing. Its infrastructure is an important part of the business model because it connects brand demand with physical availability.
Finally, large consumer-products businesses must manage input-cost volatility. PepsiCo buys agricultural commodities, packaging materials, energy and other inputs and is exposed to tariffs, foreign exchange and transportation costs. Pricing, productivity, procurement, hedging and product mix therefore matter alongside consumer demand. In 2025, for example, PBNA’s profitability was affected by higher commodity costs, including a tariff impact, while EMEA experienced higher commodity costs related particularly to dairy, potatoes and cooking oil.
How PepsiCo Solves the Problem
PepsiCo’s first solution is portfolio breadth. The company sells both beverages and convenient foods and operates brands across different price points, flavors, package formats and consumption occasions. This diversification reduces dependence on a single category and gives PepsiCo more ways to participate in consumer spending. In 2025, convenient foods generated 58% of PepsiCo revenue and beverages generated 42%.
The second solution is brand investment and innovation. PepsiCo conducts research and development around ingredients, flavors, substrates, manufacturing processes, packaging, digitalization and consumer insights. Its research centers are located across markets including Brazil, China, India, Ireland, Mexico, Russia, South Africa, the United Kingdom and the United States. The company is working on reducing added sugars, sodium and saturated fat in parts of the portfolio, adding products with functional benefits and improving packaging technologies.
The third solution is route-to-market capability. PepsiCo uses different distribution systems according to product and market economics. Some products benefit from direct-store delivery, where frequent merchandising and replenishment support shelf availability. Others can move through warehouse systems or independent distributors. Beverage operations can also use authorized bottlers, which manufacture and distribute finished beverages from PepsiCo concentrates or other inputs.
The fourth solution is geographic diversification. Operations outside the United States generated 44% of consolidated net revenue in 2025. PepsiCo reported significant revenue from Mexico, Russia, Canada, China, the United Kingdom, Brazil and South Africa in addition to the United States. This creates access to different growth markets while also exposing the company to foreign exchange, geopolitical and regulatory risks.
PepsiCo’s Business Model
PepsiCo organizes its business into six reportable segments: PepsiCo Foods North America (PFNA), PepsiCo Beverages North America (PBNA), International Beverages Franchise (IB Franchise), Europe, Middle East and Africa (EMEA), Latin America Foods (LatAm Foods), and Asia Pacific Foods. This structure reflects both product categories and operating models.
1. PepsiCo Foods North America
PFNA includes PepsiCo’s convenient-food businesses in the United States and Canada. It makes, markets, distributes and sells products such as chips, dips, cereals, granola bars, oatmeal, pasta, rice, syrups and mixes. Major brands include Cheetos, Doritos, Fritos, Lay’s, Quaker, Ruffles and Tostitos. In 2025, PFNA generated $27.528 billion of net revenue, compared with $27.431 billion in 2024.
PFNA’s economics benefit from powerful brands and an established distribution system, but volume is important. Unit volume declined 2% in 2025, including a 3% decline in savory snacks volume. Revenue nevertheless increased slightly, supported by acquisitions and effective net pricing. Segment operating profit was $6.173 billion, down from $6.619 billion in 2024.
2. PepsiCo Beverages North America
PBNA contains PepsiCo’s beverage businesses in the United States and Canada. It participates in carbonated soft drinks, sports drinks, water and other beverage categories and combines owned brands, distribution relationships and bottling infrastructure. PBNA generated $28.197 billion of net revenue in 2025, making it PepsiCo’s largest segment by revenue, narrowly ahead of PFNA.
PBNA revenue increased 1.5% in 2025, driven primarily by effective net pricing despite an organic volume decline. Unit volume fell 3%, including a 6% decline in non-carbonated beverages and a slight decline in carbonated soft drinks. Segment operating profit fell sharply to $1.089 billion from $2.302 billion, with the decline heavily influenced by a $1.539 billion impairment associated with the Rockstar brand, along with operating costs, acquisition-related charges, volume pressure and commodity costs.
3. International Beverages Franchise
IB Franchise includes PepsiCo’s international franchise beverage businesses and SodaStream. The franchise structure differs economically from company-owned finished-goods beverage operations. PepsiCo notes that finished-goods beverage operations generally generate higher reported revenue but lower operating margins than concentrate sold to authorized bottlers. Franchise operations therefore provide a comparatively asset-light revenue stream where partners undertake significant finished-goods manufacturing and distribution activity.
IB Franchise generated $4.997 billion of net revenue in 2025, up 2% from $4.879 billion. Unit volume grew 1.5%, with growth particularly in the Middle East, China and Pakistan. Segment operating profit rose 21% to $1.769 billion. That represents a much higher operating-profit-to-revenue relationship than company-owned beverage operations, illustrating why franchise beverage economics are strategically valuable.
4. Europe, Middle East and Africa
EMEA combines convenient foods with beverage businesses where PepsiCo owns bottling operations in Europe, the Middle East and Africa. The segment generated $18.025 billion in 2025 revenue, up 8% from $16.658 billion. Convenient-food volume declined 5%, while beverage volume increased slightly. Effective net pricing and favorable foreign exchange supported revenue.
EMEA generated $2.106 billion of segment operating profit, up 7%. The segment’s mixed food-and-beverage model is reflected in its revenue composition: in 2025, beverages represented 37% of EMEA revenue and convenient foods 63%.
5. Latin America Foods
LatAm Foods includes PepsiCo’s convenient-food operations across Latin America. It generated $10.549 billion of net revenue in 2025, slightly below $10.568 billion in 2024. Unit volume nevertheless grew 1%, supported by Brazil, Peru, Colombia and Argentina, partly offset by Mexico. Foreign-exchange translation was a significant headwind to reported revenue.
Segment operating profit was $2.010 billion, down 2% from $2.052 billion. Operating costs, commodity inflation, currency effects and an indirect-tax audit settlement weighed on profit, while productivity and effective pricing provided offsets.
6. Asia Pacific Foods
Asia Pacific Foods includes convenient-food businesses across Asia Pacific, including China, Australia, New Zealand and India. Revenue reached $4.629 billion in 2025, up 2% from $4.549 billion. Unit volume grew 4%, led by India, Thailand and Australia and partly offset by China.
Segment operating profit was $369 million, down 2%. The segment illustrates PepsiCo’s opportunity in international food markets but also the challenge of converting volume growth into profit when pricing, costs and brand-specific impairment charges move adversely.
How Does PepsiCo Make Money?
PepsiCo primarily makes money by distributing and selling beverage and convenient-food products to customers. Its revenue model can be understood through four lenses: product category, segment, geography and operating structure.
Revenue by product category
In 2025, 58% of PepsiCo’s consolidated net revenue came from convenient foods and 42% from beverages. This mix is central to the business model. PepsiCo is not simply a beverage company with a snack division; convenient foods are the larger revenue category. In North America, the mix was almost balanced at 51% beverages and 49% convenient foods. Internationally, convenient foods were much more important, representing 69% of revenue compared with 31% for beverages.
Company-owned bottler beverage revenue represented 36% of consolidated net revenue in 2025. PepsiCo explains that finished-goods beverage operations generally create higher reported revenue but lower operating margins than concentrate sold to authorized bottling partners. Therefore, revenue scale alone does not reveal the economics of each beverage stream.
Revenue by segment
PepsiCo’s $93.925 billion of 2025 revenue was distributed across PBNA at $28.197 billion, PFNA at $27.528 billion, EMEA at $18.025 billion, LatAm Foods at $10.549 billion, IB Franchise at $4.997 billion and Asia Pacific Foods at $4.629 billion. PBNA and PFNA together generated $55.725 billion, approximately 59% of consolidated revenue, demonstrating the importance of North America.
Profit contribution differs significantly from revenue contribution. PFNA generated $6.173 billion of segment operating profit, compared with PBNA’s $1.089 billion. IB Franchise generated $1.769 billion on only $4.997 billion of revenue. EMEA generated $2.106 billion, LatAm Foods $2.010 billion and Asia Pacific Foods $369 million. These differences reflect category economics, franchise structures, costs and one-time or comparability items.
Revenue by geography
The United States generated $52.228 billion of 2025 net revenue, approximately 56% of the total. Operations outside the United States generated 44%. Mexico contributed $6.947 billion, Russia $4.768 billion, Canada $3.729 billion, China $2.621 billion, the United Kingdom $2.142 billion, Brazil $1.782 billion and South Africa $1.767 billion. All other countries together generated $17.941 billion.
This geographic spread creates diversification, but foreign exchange can materially affect reported results. PepsiCo said unfavorable foreign exchange had a nominal negative impact on 2025 net revenue, particularly from the Mexican peso and Turkish lira, partly offset by the Russian ruble.
Pricing, volume and mix
PepsiCo’s revenue growth depends on both physical volume and effective net pricing. Effective net pricing includes discrete price changes, sales incentives and mix effects from selling different products and package sizes in different countries. In 2025, several major segments relied on pricing to offset weak volume. PFNA revenue increased slightly despite lower organic volume, while PBNA revenue grew 1.5% despite a 3% unit-volume decline. EMEA revenue grew 8% with pricing and currency support even though convenient-food volume declined.
This demonstrates an important feature of the model: strong brands can support pricing and mix management, but persistent volume declines can eventually pressure the system. PepsiCo must balance affordability with revenue per unit, especially when consumers face spending pressure or switch to lower-priced alternatives.
Competitive Advantages and Value Proposition
Complementary food and beverage portfolio
PepsiCo’s combination of convenient foods and beverages provides diversification across consumption occasions. The company can participate in snacks, meals, hydration, carbonated beverages, sports drinks and other categories while using consumer insights across a broad portfolio. This also creates opportunities to serve retailers with multiple high-turn categories.
Brand scale
Brands such as Lay’s, Doritos, Cheetos, Gatorade, Pepsi-Cola, Mountain Dew and Quaker provide consumer recognition and established demand. Brand equity supports shelf access, marketing efficiency, innovation extensions and pricing, although PepsiCo’s 2025 Rockstar impairment also demonstrates that brand value must continually be supported by consumer demand.
Distribution capabilities
PepsiCo’s route-to-market infrastructure is difficult to separate from its brand advantage. Direct-store delivery, warehouse systems, foodservice relationships, authorized bottlers and independent distributors give the company multiple methods for reaching consumers. Distribution can reinforce brand strength by improving availability and merchandising.
Global scale with local execution
Serving more than 200 countries and territories gives PepsiCo purchasing, innovation and brand scale while its regional segment structure allows adaptation to local categories and market conditions. International operations also diversify revenue away from a single economy.
Innovation and data capabilities
PepsiCo invests in research, product reformulation, packaging, manufacturing processes, AI, data analytics and omnichannel capabilities. These investments are intended to improve consumer insight, product relevance and operational efficiency as shopping and consumption behavior changes.
Future Outlook of PepsiCo’s Business Model
PepsiCo enters 2026 with a business model that remains highly diversified but is being reshaped. In 2025, revenue grew 2% to $93.925 billion while operating profit declined 11%. North American volumes were pressured, PBNA experienced significant impairment and acquisition-related effects, and the company continued substantial restructuring activity. At the same time, international segments showed areas of volume or revenue growth and the franchise beverage model remained highly profitable.
Portfolio transformation is a major theme. PepsiCo is working to reshape products around changing consumer preferences, including reducing added sugar, sodium and saturated fat in parts of the portfolio, removing certain artificial colors and flavors, developing functional products and integrating acquired brands such as Siete, Sabra and poppi. The acquisitions also broaden PepsiCo’s participation in categories that may complement its established brands.
Productivity is equally important. PepsiCo’s multi-year productivity plan has been extended through 2030 and uses technology, automation, process harmonization, organizational simplification and manufacturing and supply-chain optimization. The company expects total pre-tax charges of approximately $6.15 billion under the plan, with $3.6 billion incurred through the end of 2025. The objective is a lower cost structure, faster decision-making and improved competitiveness.
Cash generation gives PepsiCo capacity to fund these priorities. Operating activities generated $12.1 billion in cash in 2025. Investing cash outflow included acquisitions of poppi and Siete as well as capital spending, while the company returned cash to shareholders through dividends and share repurchases.
Ultimately, PepsiCo’s model depends on maintaining the interaction between brands, innovation, pricing, volume, distribution and productivity. Its food-and-beverage diversification provides resilience, but 2025 demonstrates that scale does not eliminate execution risk. Future value creation will depend on restoring stronger volume performance in mature businesses, integrating acquisitions, adapting the portfolio to consumer preferences and converting productivity investments into sustainable margin improvement.
Customer economics and concentration
Retail customer relationships are another important layer of PepsiCo’s economics. The company sells through large retailers, foodservice customers and numerous other channels, and scale with major customers can create both efficiency and concentration risk. In 2025, sales to Walmart and its affiliates, including Sam’s, represented approximately 14% of consolidated net revenue, including concentrate sales to independent bottlers that ultimately supported finished goods sold to Walmart. This illustrates how PepsiCo’s consumer brands ultimately depend on powerful retail and distribution partners for access to shoppers.
At the same time, the breadth of PepsiCo’s portfolio can strengthen its relevance to retailers. A single supplier can provide high-volume convenient foods and beverages across numerous brands and consumption occasions. The model therefore creates a reinforcing system: consumer demand supports retailer shelf space; distribution supports product availability; product availability reinforces brand consumption; and scale supports continued investment in marketing, innovation, manufacturing and route-to-market capabilities.
Source: PepsiCo, Inc., 2025 Annual Report / Form 10-K.