
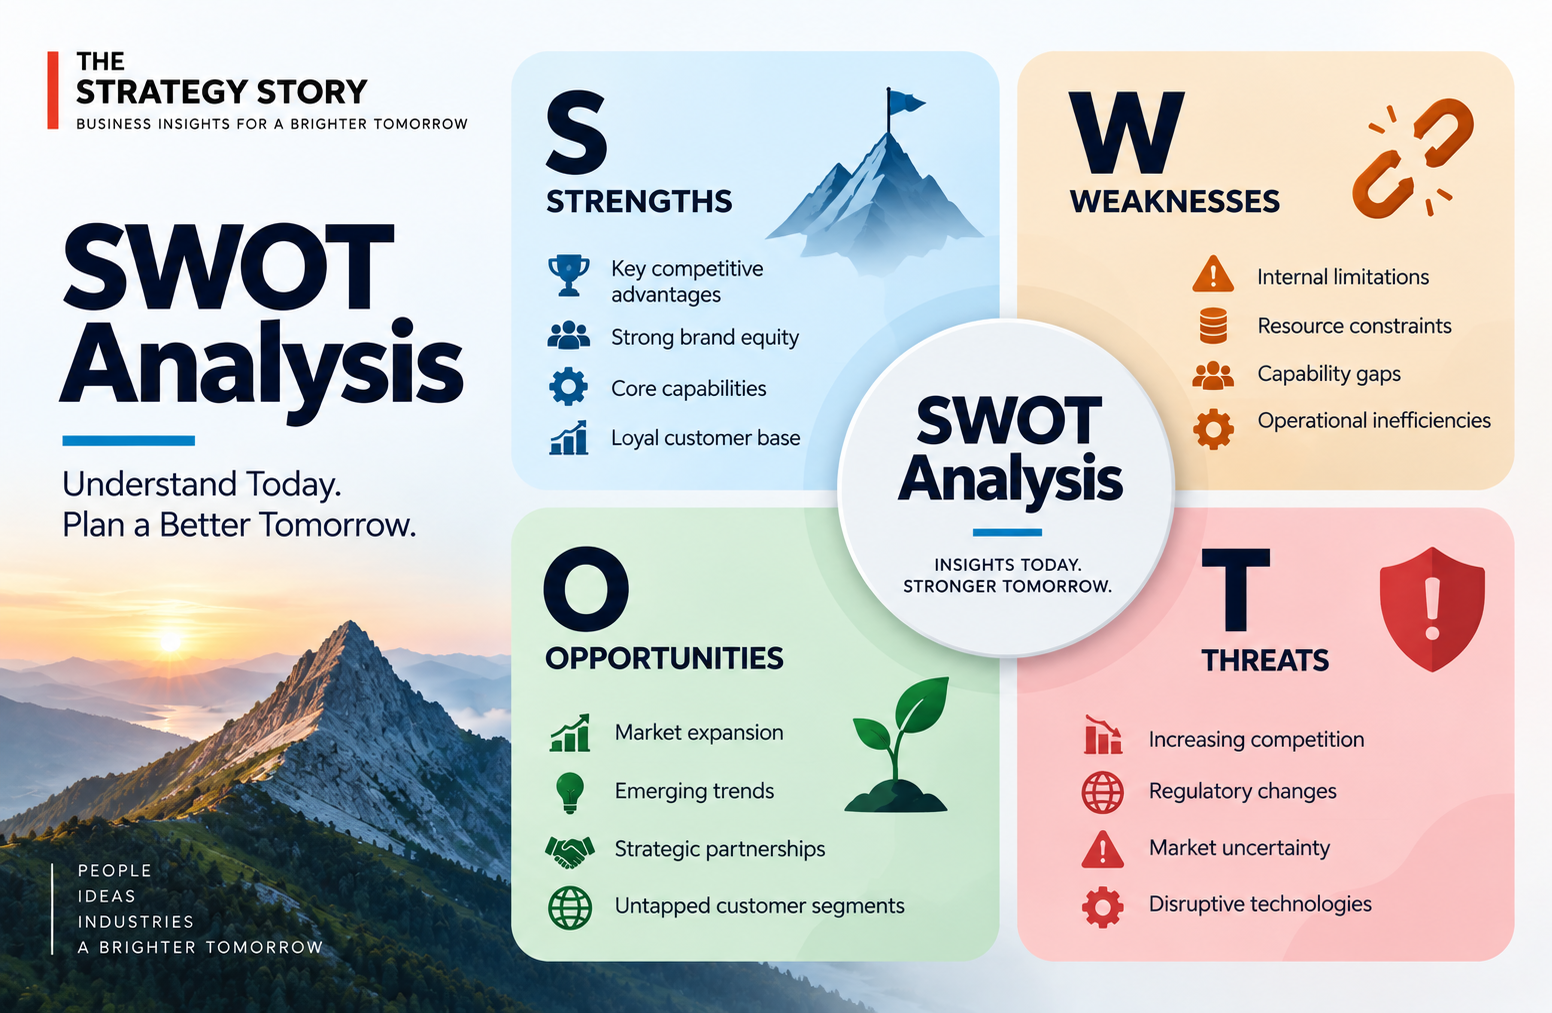
Applied Materials enters 2026 from a position of financial and technological scale, but it also faces unusually high geopolitical and industry-cycle exposure. The company generated $28.37 billion of fiscal 2025 revenue and $8.0 billion of operating cash flow, while China still represented 30% of revenue despite a sharp decline. The SWOT below uses only Applied Materials’ FY2025 Form 10-K.
Strengths
1. Broad semiconductor equipment portfolio
Applied describes Semiconductor Systems as the industry’s most comprehensive portfolio. Breadth enables the company to address multiple process steps and pursue connected, co-optimized solutions as device structures become more complex. This strategic architecture is explored further in our Applied Materials Business Strategy 2026.
2. Scale in the core Semiconductor Systems segment
Semiconductor Systems produced $20.80 billion of revenue in 2025, about 73% of company revenue, with a 54.2% gross margin and 35.5% operating margin. That combination of scale and profitability gives Applied substantial resources to reinvest.
3. Large installed-base service engine
AGS generated $6.39 billion of revenue and $7.14 billion of backlog. Services, spares and factory software create recurring monetization opportunities after equipment is installed, reducing reliance on one-time system sales.
4. Strong innovation capacity
RD&E spending reached $3.57 billion, up about 10% year over year. Applied deliberately invests before strong demand emerges so its products can enter customer manufacturing plans during early technology selection.
5. Strong cash generation
Operating cash flow was $8.0 billion in fiscal 2025. This financial capacity supports R&D, manufacturing investments and resilience through semiconductor cycles. The underlying revenue architecture is detailed in our Applied Materials Business Model 2026.
Weaknesses
1. High dependence on semiconductor capital spending
The largest business depends on customers’ capacity additions and technology transitions. Semiconductor equipment spending can fluctuate significantly, creating volatility even when long-term semiconductor demand remains attractive.
2. Customer and market concentration
Foundry, logic and other represented 67% of Semiconductor Systems revenue in 2025. While this category is broad, large customers and concentrated semiconductor manufacturing ecosystems can materially influence purchasing patterns.
3. Geographic exposure to China
China still represented $8.53 billion, or 30%, of 2025 revenue. That creates meaningful exposure to regulatory restrictions and competitive displacement even after revenue from the country fell 16%.
4. High fixed commitment to innovation
RD&E of $3.57 billion is strategically necessary but economically demanding. Applied must keep investing across cycles because failing to qualify technologies early can weaken future process positions.
5. Smaller adjacent businesses have different economics
Corporate and Other generated $1.19 billion of revenue and a 48.7% gross margin, but included businesses such as display equipment that face their own volatile investment cycles. This adds complexity without matching the scale of the core semiconductor franchise.
Opportunities
1. AI and data-center semiconductor investment
Applied identifies data-center AI as a major secular driver. AI requires leading-edge logic, advanced memory and sophisticated packaging, allowing Applied to participate across several technology layers.
2. High-bandwidth memory
Management expects growth in HBM adoption to support equipment investment. HBM requires complex memory and packaging processes, expanding opportunities for materials engineering.
3. Advanced packaging
As performance improvements increasingly depend on integrating multiple chips, advanced packaging becomes a larger part of semiconductor manufacturing value. Applied specifically identifies this as a growth area.
4. Expansion of installed-base services
Applied expects service demand to grow as installed systems and chambers increase and customers renew long-term agreements. Each new system placement can therefore create a future stream of spares and service opportunities.
5. Technology transitions across non-leading-edge nodes
Demand is not limited to the most advanced chips. Applied expects continued investment in non-leading-edge nodes used across automotive, industrial, IoT and other applications, broadening the addressable market.
Threats
1. Tightening export controls
U.S. regulations have restricted certain semiconductor products and services to customers in China, and further changes could reduce the addressable market. This is one of the most material external constraints discussed in our Applied Materials PESTEL Analysis 2026.
2. Chinese domestic competition
Applied warns that inability to obtain export licenses may cause it to be displaced by foreign and Chinese domestic companies. Restrictions can therefore create not only lost sales but long-term competitive substitution.
3. Semiconductor industry cyclicality
Customer spending can change quickly with capacity utilization, end demand and technology timing. Backlog of about $15.0 billion provides visibility but is subject to amendments, cancellations, delivery changes and export rules.
4. Supply-chain and trade-policy disruption
Tariffs, retaliatory measures and evolving trade policies create cost and planning uncertainty. Semiconductor equipment also relies on complex global supply networks, making disruption potentially consequential.
5. Failure to anticipate technology transitions
The value of Applied’s portfolio depends on developing commercially relevant tools before customers lock in manufacturing processes. Missing a major device architecture, materials or packaging transition could weaken both equipment sales and the downstream service opportunity.
Source: Applied Materials, FY2025 Form 10-K.